“If you can’t explain something simply, you don’t understand it well enough.”
ThothBI
Listen to the Story Behind Your Data
Interpret your data with ThothBI, a homegrown business intelligence application featuring rich visualization capabilities. Developed using the latest technologies, ThothBI delivers a wide range of advanced visualization interfaces—including map-based and real-time data analytics—to meet all your enterprise reporting and analysis needs.
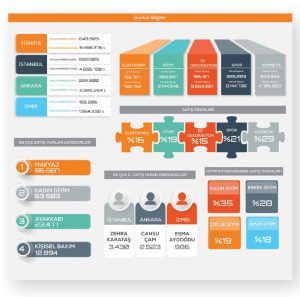
Interactive Infographics and Automated Reporting
Prepare the reports, briefings, and press releases you regularly present to senior management, the media, or the public using infographics enriched with advanced visualization options. Create template-based analyses that always reflect the most up-to-date data, and automatically distribute these reports via email using scheduled tasks.
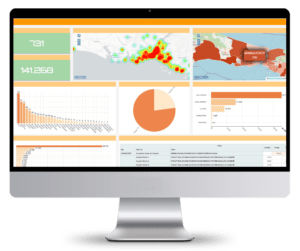
Built-in Spatial Analytics Support
Analyze your data in the spatial dimension with built-in geographic analytics support. Visualize clusters of high and low values on heat maps, and use the drill-down feature to select a specific location on the map and instantly update all data based on the selected area. The instant location search automatically populates and refreshes dashboards and maps with data related to defined regions. View and analyze multiple datasets as separate layers on maps, standardize and filter data from different sources for consistent analysis, and dynamically extend your map analytics by adding WMS and WFS data sources. You can also use your own base maps in offline environments.
Goal-Oriented Data Analytics
Stand out in today’s competitive landscape, where those who truly understand their data gain the advantage in the age of big data. With ThothBI, a homegrown business intelligence system designed for use across a wide range of industries, focus on what matters most in the big data world. Transform raw data into insight, identify risks and opportunities, and define a clear roadmap for the future.
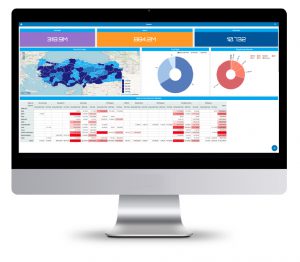
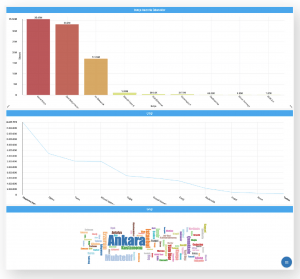
Interactive and Rich Visualization Options
Leverage a wide range of interactive visualization options tailored to the type, variety, and level of detail of your data—including tables, pivots, polygons and heat maps, bar, line and pie charts, word clouds, rich text, dashboards, traffic lights, and many more. Any interaction with an element on the page is automatically applied as a filter across all other reports, ensuring the entire dashboard is instantly updated based on the same criteria.
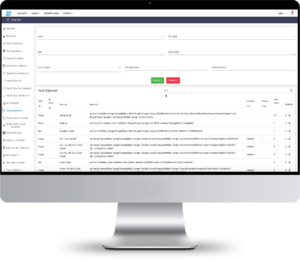
Direct Connectivity to All Databases
Connect directly to all widely used databases. With ThothBI’s data layer, which generates optimized queries, achieve the fastest possible results across all database systems. Quickly and efficiently design the data models required for reports tailored to your needs using built-in data modeling tools.
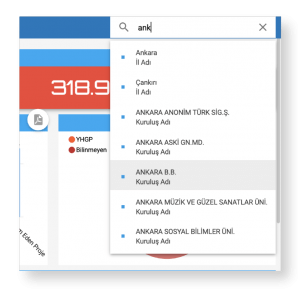
Fast Access with Smart Search
Access the information you need in seconds with the unique Smart Search feature. By entering your criteria into the search box available on every page, ThothBI scans dozens of options to instantly list relevant results and, with a single action, automatically filters and updates the entire dashboard based on your input—making information retrieval fast and effortless.

Dockerized Horizontal Scaling Support
Run ThothBI within containerized environments as the only product on the market offering full Dockerization. Scale your system rapidly and seamlessly according to demand, without service interruptions. Designed to deliver efficient performance in multi-user enterprise environments, this capability enables ThothBI to operate at high performance across all industries and organizational scales.